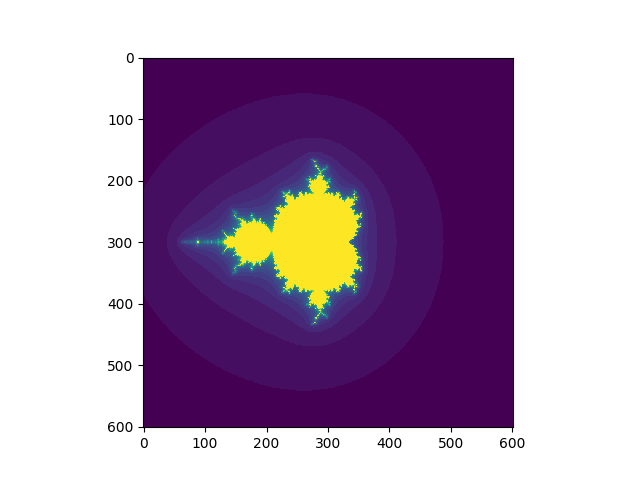
Mandelbrot Python example
%matplotlib ipympl
import numpy as np
import matplotlib.pyplot as plt
xrange = 2.5
yrange = 2.5
nx = 601
ny = 601
image = np.zeros((nx,ny))
x = np.linspace(-xrange,xrange, nx)
y = np.linspace(-yrange,yrange, ny)

xv, yv = np.meshgrid(x,y)
z0 = np.zeros(shape=(nx,ny), dtype='float')
counter = np.zeros(shape=(nx,ny), dtype='int')

z_re = z0[:,:]
z_im = z0[:,:]

limit = 100000000

# mandelbrot folge:
for i in range(30):
    z_re_new = z_re**2 - z_im**2 + xv
    z_im_new = 2 * z_re * z_im + yv

    z_re = z_re_new.clip(-limit,limit)
    z_im = z_im_new.clip(-limit,limit)
    counter[z_re**2 + z_im**2 < 100000] += 1

plt.imshow(counter)
plt.show()

